In statistics, a histogram is a graphical representation showing the distribution of data. In photography, a histogram shows the distribution of colors across the dynamic range of the camera or the color set of the image. Almost all cameras have a histogram display feature in them today, thus allowing you to judge whether your image is correctly exposed or not. To correctly understand histograms, you'd need to compare different images and their histograms. This post will simply help you understand what the graph on your screen says and whether you should listen to it all or not.
To understand histograms, let me first skim through the concepts of dynamic range and contrast ratio.
Dynamic Range
Each camera has a limit to the number of color/light levels that it can capture. This is called the Dynamic Range of the camera. Technically speaking, Dynamic Range describes the ratio between the maximum and
minimum measurable light intensities (white and black, respectively). Let's try to understand this concept.
The sensor captures data in an analog form. This analog signal is then converted into a digital signal and sent to the camera's processor. Let's assume that the processor accepts an 8bit signal. So each pixel on the sensor sends out the pixel color/intensity information as an 8bit signal to the processor.
With 8 bits to represent each pixel signal, we end up with 28=256 levels of intensity within which this signal can lie. As shown below, a histogram in an 8bit digital camera shows the spread of different pixels between the darkest (0) and brightest(255) light intensities. Simply put, a histogram's vertical axis shows how much of the image is found at a particular brightness level. Here we can see that the image has more dark areas than bright.

Coming back to the topic of dynamic range, a camera which uses more bits for encoding the analog pixel signal into a digital signal will have a wider bright-to-dark light spectrum and hence will capture colors more accurately at different light intensities.
Contrast Ratio
Some manufacturers or comparison websites express the camera's dynamic range with the term "contrast ratio". This number will look something like "1000:1". So how should we look at this concept?
Assume each pixel to be a bucket; a bucket that collects light photons. The more photons that a bucket collects, the brighter than bucket becomes. Now each bucket has a limit to the number of photons it can collect (and report to the camera processor). This depends on the number of bits used to convert the analog signal to digital. Let's assume the camera uses 8 bits which means the bucket can contain a maximum of 256 photons beyond which it will overflow (be overexposed). The lesser the photons, the darker the image.
| Image courtesy: cambridgecolor.com |
Contrast is the ratio between the brightness and darkness levels of the image. The lower the contrast, the more dirty/lacklustre/dusty the image looks; as you increase contrast, bright areas become brighter and dark areas become darker thus giving the image more clarity until a point beyond which the image starts looking unnatural. In the below image, starting from the lower left corner image (this image has the lowest contrast) you can see that as the contrast level is increased the dusty feel of the image starts wearing off and the image becomes more bright/sharp and clean. As we move clockwise towards the lower right image, the contrast levels have been increased too high to give the image an unnatural feel.
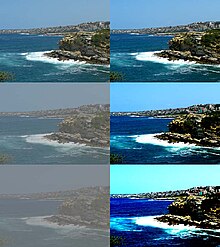 |
| Image Courtesy: wikimedia.org |
A contrast ratio of 1000:1 means the camera uses a minimum of 1 photon in a pixel to represent the darkest area as compared to a 1000 photons to represent the brightest area. The more the maximum number of photons that can be captured by the pixel, the larger the range of intensities that the sensor can capture. So a higher contrast ratio is always better since the camera will yield a higher dynamic range (provided the number of bits used by the camera for representing the light signal doesn't act as a limiter).
So to summarize, Dynamic Range/Contrast Ratio is the ratio between the maximum and
minimum measurable light intensities.
How does dynamic range relate to histograms?
If you have accurately understood the point that I am trying to drive home, you may have realized that dynamic range forms the X-axis of the histogram - the range of brightness levels that the camera can capture :)
As the dynamic range increases, the width/number of intensity levels of the histogram increases and hence the graph becomes a more accurate representation of light intensities.
How does a histogram help?
There is nothing called a "good histogram". A histogram only tells you whether the image has too many pixels at a particular brightness/darkness level or if the intensities are well spread out. Knowing this helps you avoid posterization during post-processing and helps gauge whether the image is over/under exposed. How do you judge the below histogram?
 |
| Image courtesy: luminous-landscape.com |
If you do not look at the image and only check out the histogram, your knee-jerk judgement would be that it is a bad image, won't it? :) But histograms are certainly useful, as can be seen in this post.
No comments:
Post a Comment